Binary Classification of Forward-Looking Statements
Paper + Venue + Topic
This paper Extraction of Forward-looking Financial Information for Stock Price Prediction from Annual Reports Using NLP Techniques by Alexander Glodd and Diana Hristova was published in the Proceedings of the 56th Hawaii International Conference on System Sciences in 2023. This research explores forward-looking statements, annual report analysis, 10-K filings, BERT models, stock price prediction, and natural language processing techniques.
The Problem + Why it Matters
This work examines financial documents for a number of reasons. First, the authors argue that there is an increasing volume of financial data generally, and more specifically, textual data. The textual data matters because analysts and investors obtain "both quantitative financial metrics on company performance and corresponding textual analysis of those numbers from the management’s perspective.” Another reason this increase in volume matters is that systems need to have the capability to extract information, as the authors argue that reports are mostly manually read to extract important information for decision support, which is “very labor-intensive.”
The authors also argue that forward-looking statements (FLS) are their data modality of interest. They define an FLS as “a short sentence that contains information likely to have, or refer to, a direct effect in the foreseeable future..." (Noce, Zamberletti, Gallo, Piccoli, & Rodriguez, 2014, p. 2). This is significant because of the aforementioned interest from analysts and investors, as well as the U.S. Securities and Exchange Commission. Additionally, analysts could use FLS (combined with general historical time series) to predict stock prices—which is conducted in this work—resulting in better model performance compared to using only general historical time series. This matters because investors seek financial gain, and any outcome other than a gain, such as a loss, could result in distress, the loss of life savings, or a reduced retirement fund.
Regarding systems that identify FLS prior to this work, authors previously tried keywords, rules, and machine learning (ML) approaches. The problem with keywords (e.g., ”will”, “expect”) is that they lead to false positives and rules have limited scalability. The ML approach seemed to work well enough that this work builds upon it using deep learning in natural language processing (NLP), specifically transformers and their variants.
The Method
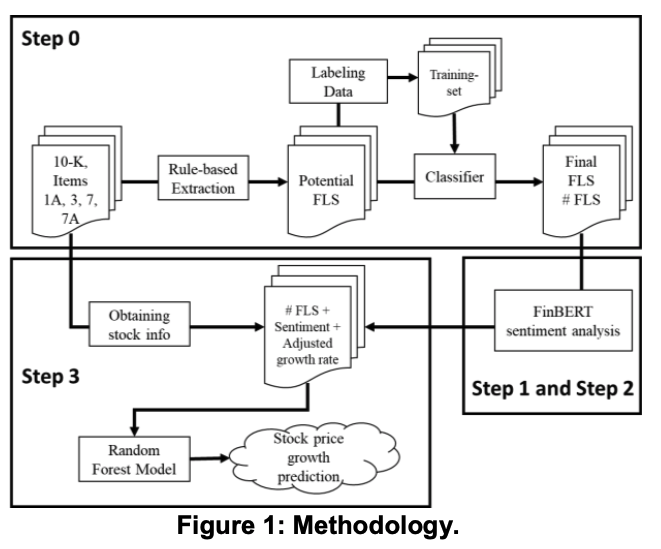
The authors' methodology has three main tasks. The first task is identifying FLS in text (Step 0), which follows the approach by Tao et al. (2018). The second task is sentiment analysis using FinBERT (Step 1 and Step 2). The last task is forecasting the stock price (Step 3) using three configurations across five timesteps.
To identify FLS, the authors first conduct a keyword search with the combination of words in the quote below.
- Combinations of the words "next", "subsequent", "following", "upcoming", "incoming", "coming", "succeeding", "carryforward" with time-period indicators "month", "quarter", "year", "fiscal", "taxable", "period".
- The words "aim", "anticipate", "assume", "commit", "estimate", "expect", "forecast", "foresee", "hope", "intend", "plan", "predict", "project", "seek", and "target" used as a verb (to differentiate from their nouns that are not necessarily used with temporal meaning, e.g. “a project”).
- Years (defined as 4-digit numbers starting with a “1” or “2”) greater than the year of publication.
They only consider FLS sentences that contain precise information (e.g., "we expect this trend to continue"), while uncertain sentences without indication of likelihood are excluded (e.g., "sales may decrease if we fail to deliver on our promises").
After the keyword search, they train three classifiers: support vector machine (SVM), long short-term memory (LSTM) model, and BERT model based on DistilBERT. They train the models, then apply them or run inference on the remaining dataset, resulting in three different datasets.
For sentiment analysis, they use FinBERT to determine the sentiment of the identified FLS. While researchers traditionally use the final predicted class, the authors of this paper use the logit score instead. A logit score represents the raw output of the model before it is converted into a probability. They justify this by noting that a final class can be misleading; for instance, a distribution of 34% positive, 33% neutral, and 33% negative would be labeled as "positive," even though the difference between the classes is negligible. By using logits, it's my understanding that the authors are aiming to capture the actual confidence of the model, preventing the loss of nuance that occurs when forcing a sentence into a single category.
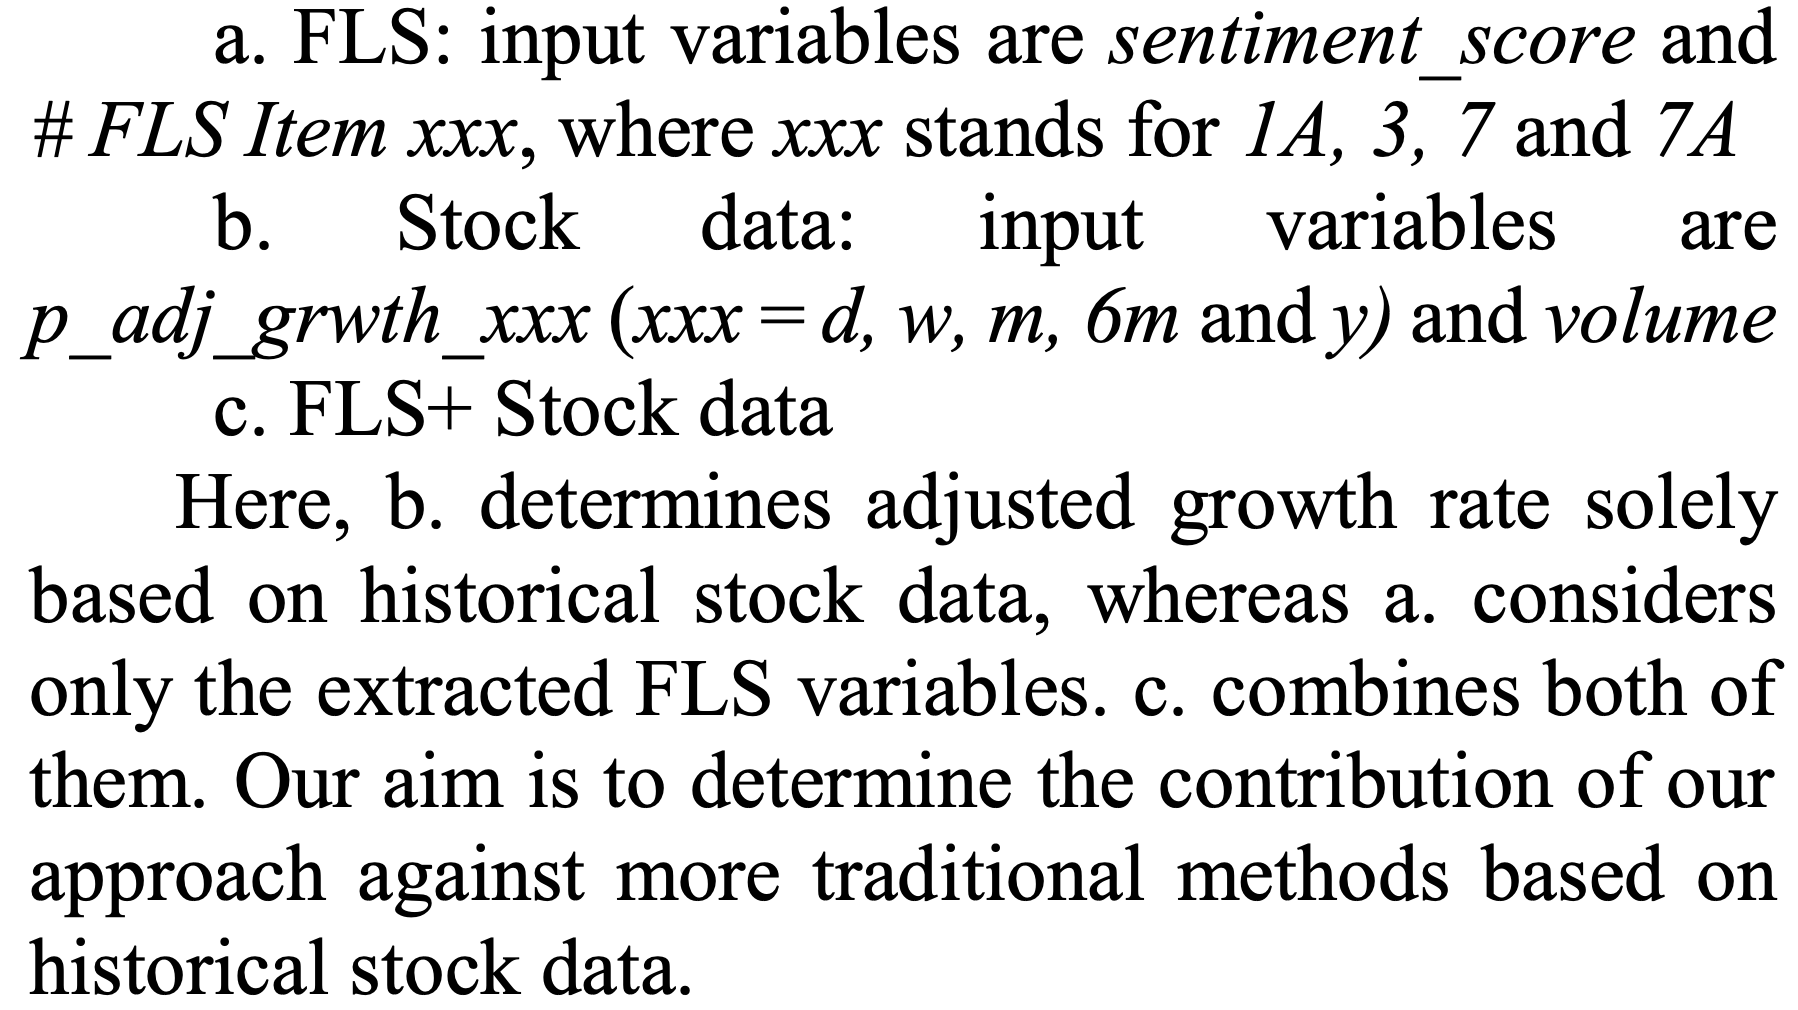
For forecasting stock prices, they use the extracted FLS and historical data across the three configurations (FLS data alone, historical prices alone, and both FLS and historical prices) across five timesteps (one day, one week, one month, six months, one year).
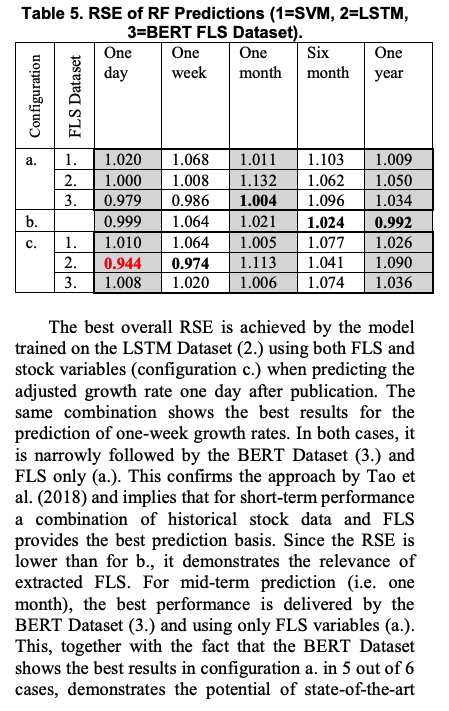
They report the empirical results:
- FLS + historical stock outperforms historical stock alone for the short-term.
- Using FLS alone + DistilBERT exhibits the best result for the mid-term prediction.
- FLS provide no benefit for the long-term.
What is Genuinely Novel
Their system generally, and more specifically Step 3 of their system, is genuinely novel. The finding that identifying FLS and combining them with historical data outperforms using FLS alone or historical data alone is novel. This improves on the baseline of other works. This also provides practical insight for downstream multimodal systems.
Limitations
-
L1. Data Coverage: They exclude uncertain sentences that have no clear indication of likelihood, such as "sales may decrease if we fail to deliver on our promises." This narrows the coverage of the system by leaving out vague but still potentially meaningful FLS.
-
L2. Data / Domain: A limitation of this work is its reliance on a single dataset, namely 10-K annual reports, and a single domain, finance. While the authors demonstrate strong performance on this specific format, the results may not generalize well to other types of financial documents, such as quarterly earnings reports (10-Qs), prospectuses, or analyst reports, nor to other fields such as policy analysis, medical research, sports, or climate forecasting. This constrains the real-world usefulness, scalability, and transferability of the system.
-
L3. Explainability: They do not provide an in-depth explainability analysis of what within the FLS contributes to the result that FLS + historical stock data outperforms historical stock data alone in the short term. For instance, it remains unclear whether the gains come mostly from explicit future-oriented words, sentiment strength, statement counts, or interactions among these features.
-
L4. Modeling: Another limitation is the use of only Random Forest in Step 3. Other regression models, such as Stochastic Gradient Descent regressors, Lasso, ElasticNet, or Support Vector Regressor, could also have been evaluated. Random Forest may perform well here, but it may not be the best downstream predictor for the task.
Ideas for Our Work
-
I1. Data Coverage (addresses L1): Embodied in our TOLSA-M definition is uncertainty. Thus, we include uncertain sentences without explicit indication of likelihood, such as "sales may decrease if we fail to deliver on our promises," whereas they do not. We include these because the measurable property is still present—for example, the attribute is sales and the slope is decrease—so the TOLSA-M remains potentially valid and later verifiable.
-
I2. Data + Domain (addresses L2): This work confirms our binary classification approach with TOLSA-M (12,969) vs. non-TOLSA-M (13,229), mirroring their FLS identification task. To address data specificity, our dataset is not limited to one domain; instead, it spans multiple sources, including synthetic, financial phrasebank, chronicle2050, TimeBank, YouTube, News API, multimodal forecasting for climate, Clients, Rivals and Rogues, and Forecast Bench. This broader coverage aligns with our motivation that current systems are too narrow in domain coverage.
-
I3. Explainability + Data Extension (addresses L3, extends beyond L1): We map TOLSA-Ms to sentiment analysis by leveraging the financial phrasebank dataset, which already contains sentiment labels (positive, negative, neutral). The sentiment counts across TOLSA-M labels are:
- positive = 1,363 total (1,197 with non-prediction, 166 with prediction)
- negative = 604 total (555 with non-prediction, 49 with prediction)
- neutral = 2,879 total (2,636 with non-prediction, 243 with prediction)
This kind of sentiment analysis complements the TOLSA-M taxonomy in a few ways: by studying whether the sentiment of a TOLSA-M correlates with outcome correctness or source reliability, and by introducing a sentiment dimension.
-
I4. Dataset + Modeling (addresses L4): We could leverage TOLSA-Ms as input features for downstream forecasting tasks across multiple domains, such as sports, policy, weather, and finance, similar to how they use FLS for stock price prediction. In doing so, we would survey a broader family of downstream models rather than relying on a single predictor.
-
I5. Data Collection: This paper (in Step 0) follows a preprocessing procedure to identify potential FLS. They first use a rule-based approach to filter, then manually review and label sentences. This work validates our News API data collection pipeline: keyword-based filtering (of returned results from the query) followed by human-annotated sentence-level correction.
For more information about our research, return to our homepage: ufdatastudio.com.
For more from Detravious on NLP research (including the TOLSA-M Taxonomy), research and industry collaborations, faith in Jesus, and broader writings, visit: Research Portfolio | LinkedIn | Medium, or contact via email at dj.brinkley@ufl.edu.