RISE-NLP: Interactive Residual Distribution Diagnostics for Fairness Auditing in Text Classification

Accepted to the EMNLP 2026 Demo Track (System Demonstrations). The demo will be presented in Budapest, October 24–29, 2026.
The paper
RISE-NLP: Interactive Residual Distribution Diagnostics for Fairness Auditing in Text Classification.
Ray Chen, Kevin Kurian, and Christan Grant. University of Florida.
To appear in the Proceedings of the 2026 Conference on Empirical Methods in Natural Language Processing: System Demonstrations. Association for Computational Linguistics.
Group fairness numbers such as Demographic Parity and Equalized Odds collapse a classifier into one score per subgroup. A model can look acceptable on those averages and still pile its mistakes into one part of the probability range: the middle, the band around the decision threshold, or the high-confidence tails.
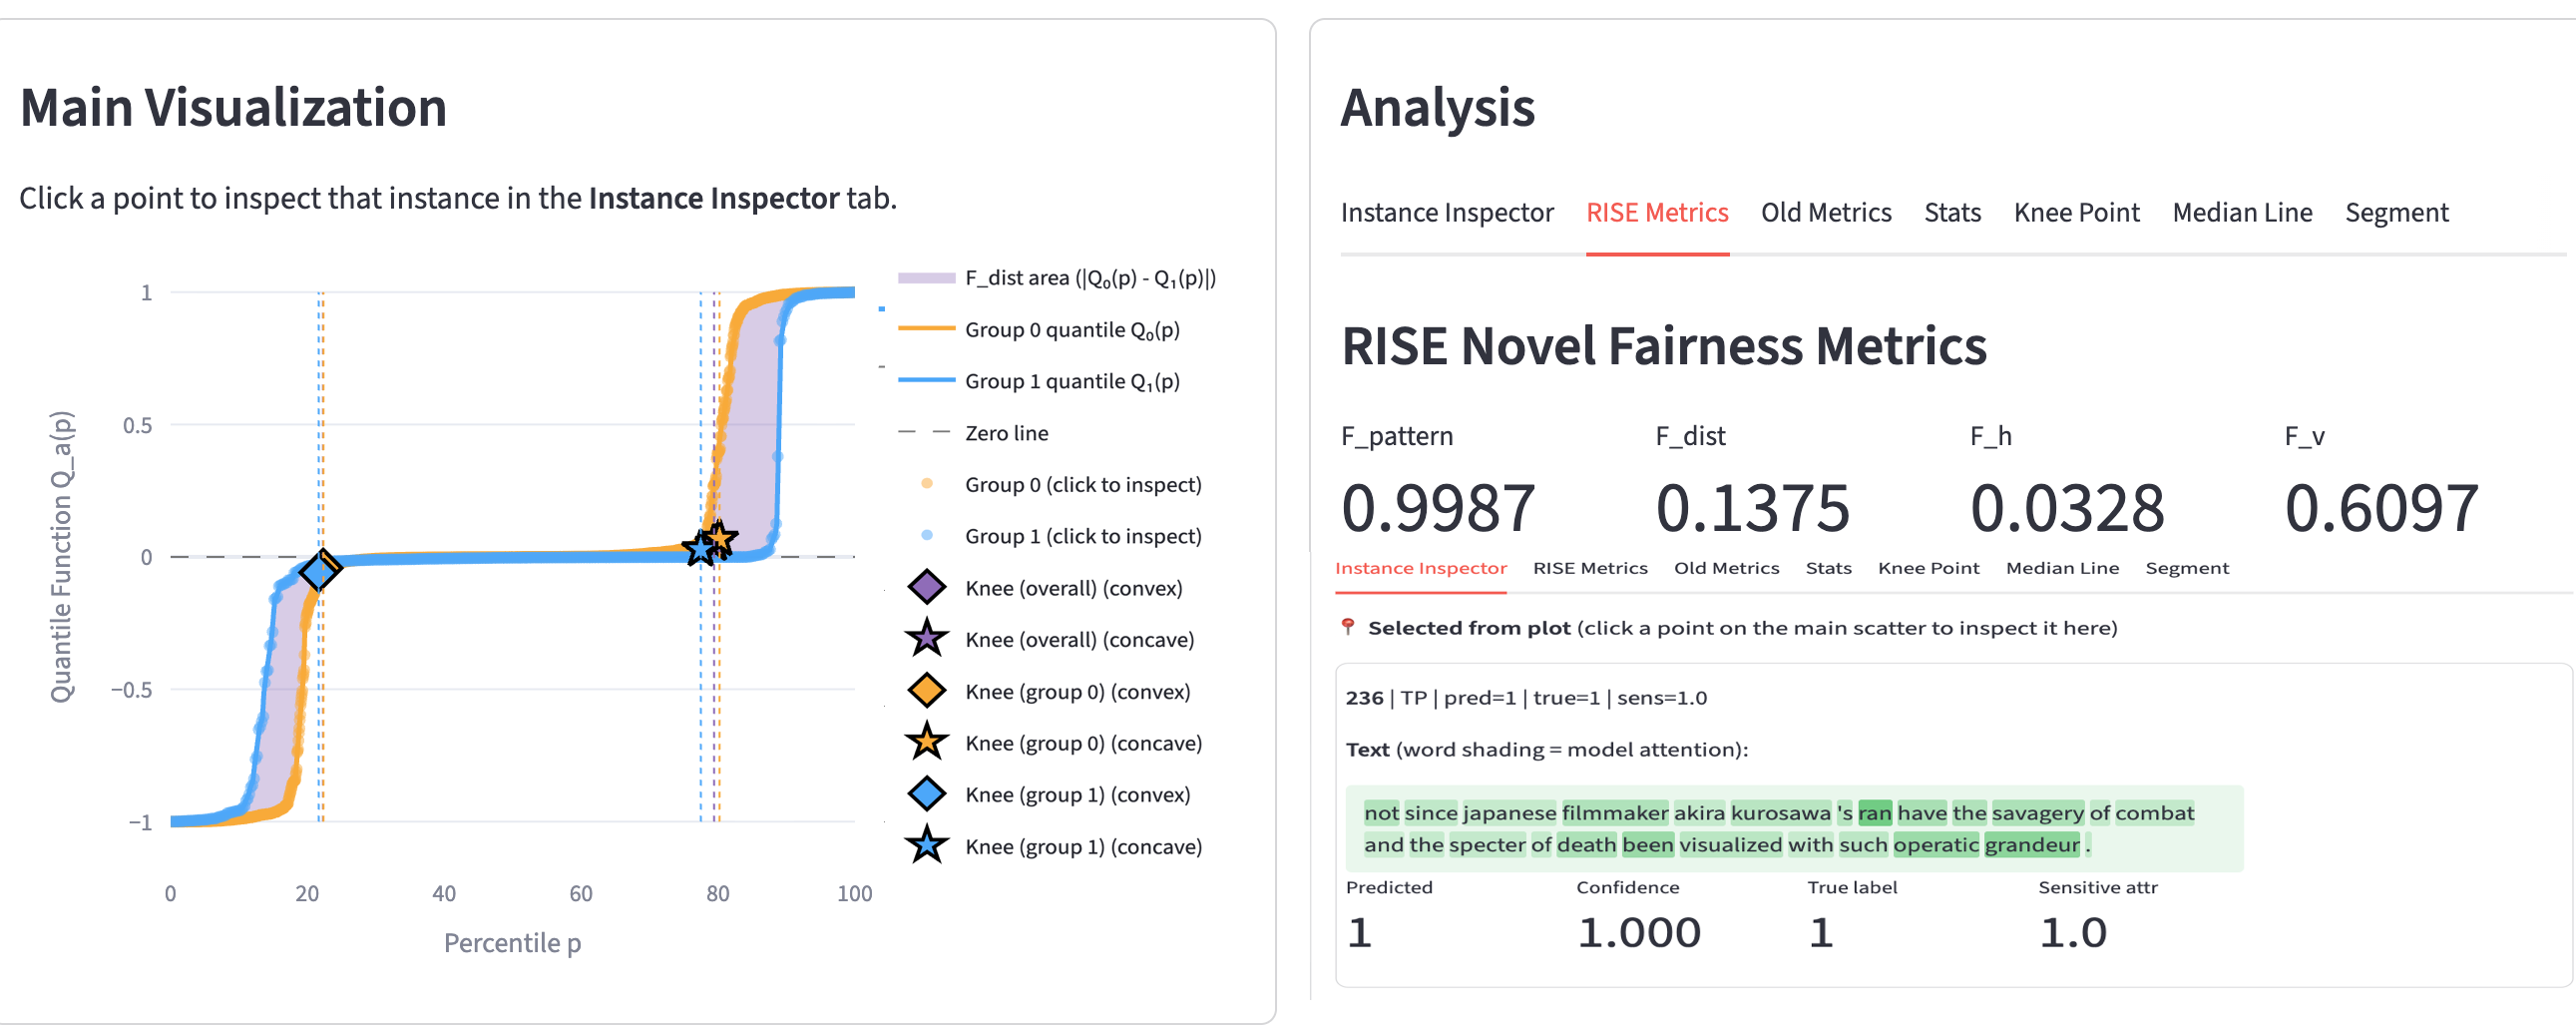
RISE-NLP is an interactive auditor for probabilistic text classifiers. It starts from the signed residual d = p_hat_plus - y, the gap between the predicted probability of the positive class and the label, and draws one quantile curve per subgroup. Where the curves pull apart is where the disparity sits. Fdist, the Wasserstein-1 distance, is the shaded area between those curves. Fpattern checks whether the subgroup medians line up.
Select a percentile band on the plot and the same screen lists the sentences in that band, with the prediction, the model's confidence, the gold label, and the subgroup tag. The demo is built so an auditor can move from a curve to the text that produced it.
On SST-2 with a random binary attribute, the curves mostly overlap and Fdist stays small (about 0.055–0.058). On identity-linked hate-speech data the gap is larger: about 0.137–0.150 on HateXplain. BERT and RoBERTa toxicity classifiers can post similar aggregate scores and still draw different residual curves. A study with 16 participants found that 12 said the interface helped them reason about the fairness–accuracy trade-off, and 10 said they would use the system.
Live demo: https://rise-nlp.streamlit.app/
Questions about the paper or the demo: chenz1@ufl.edu
Poster
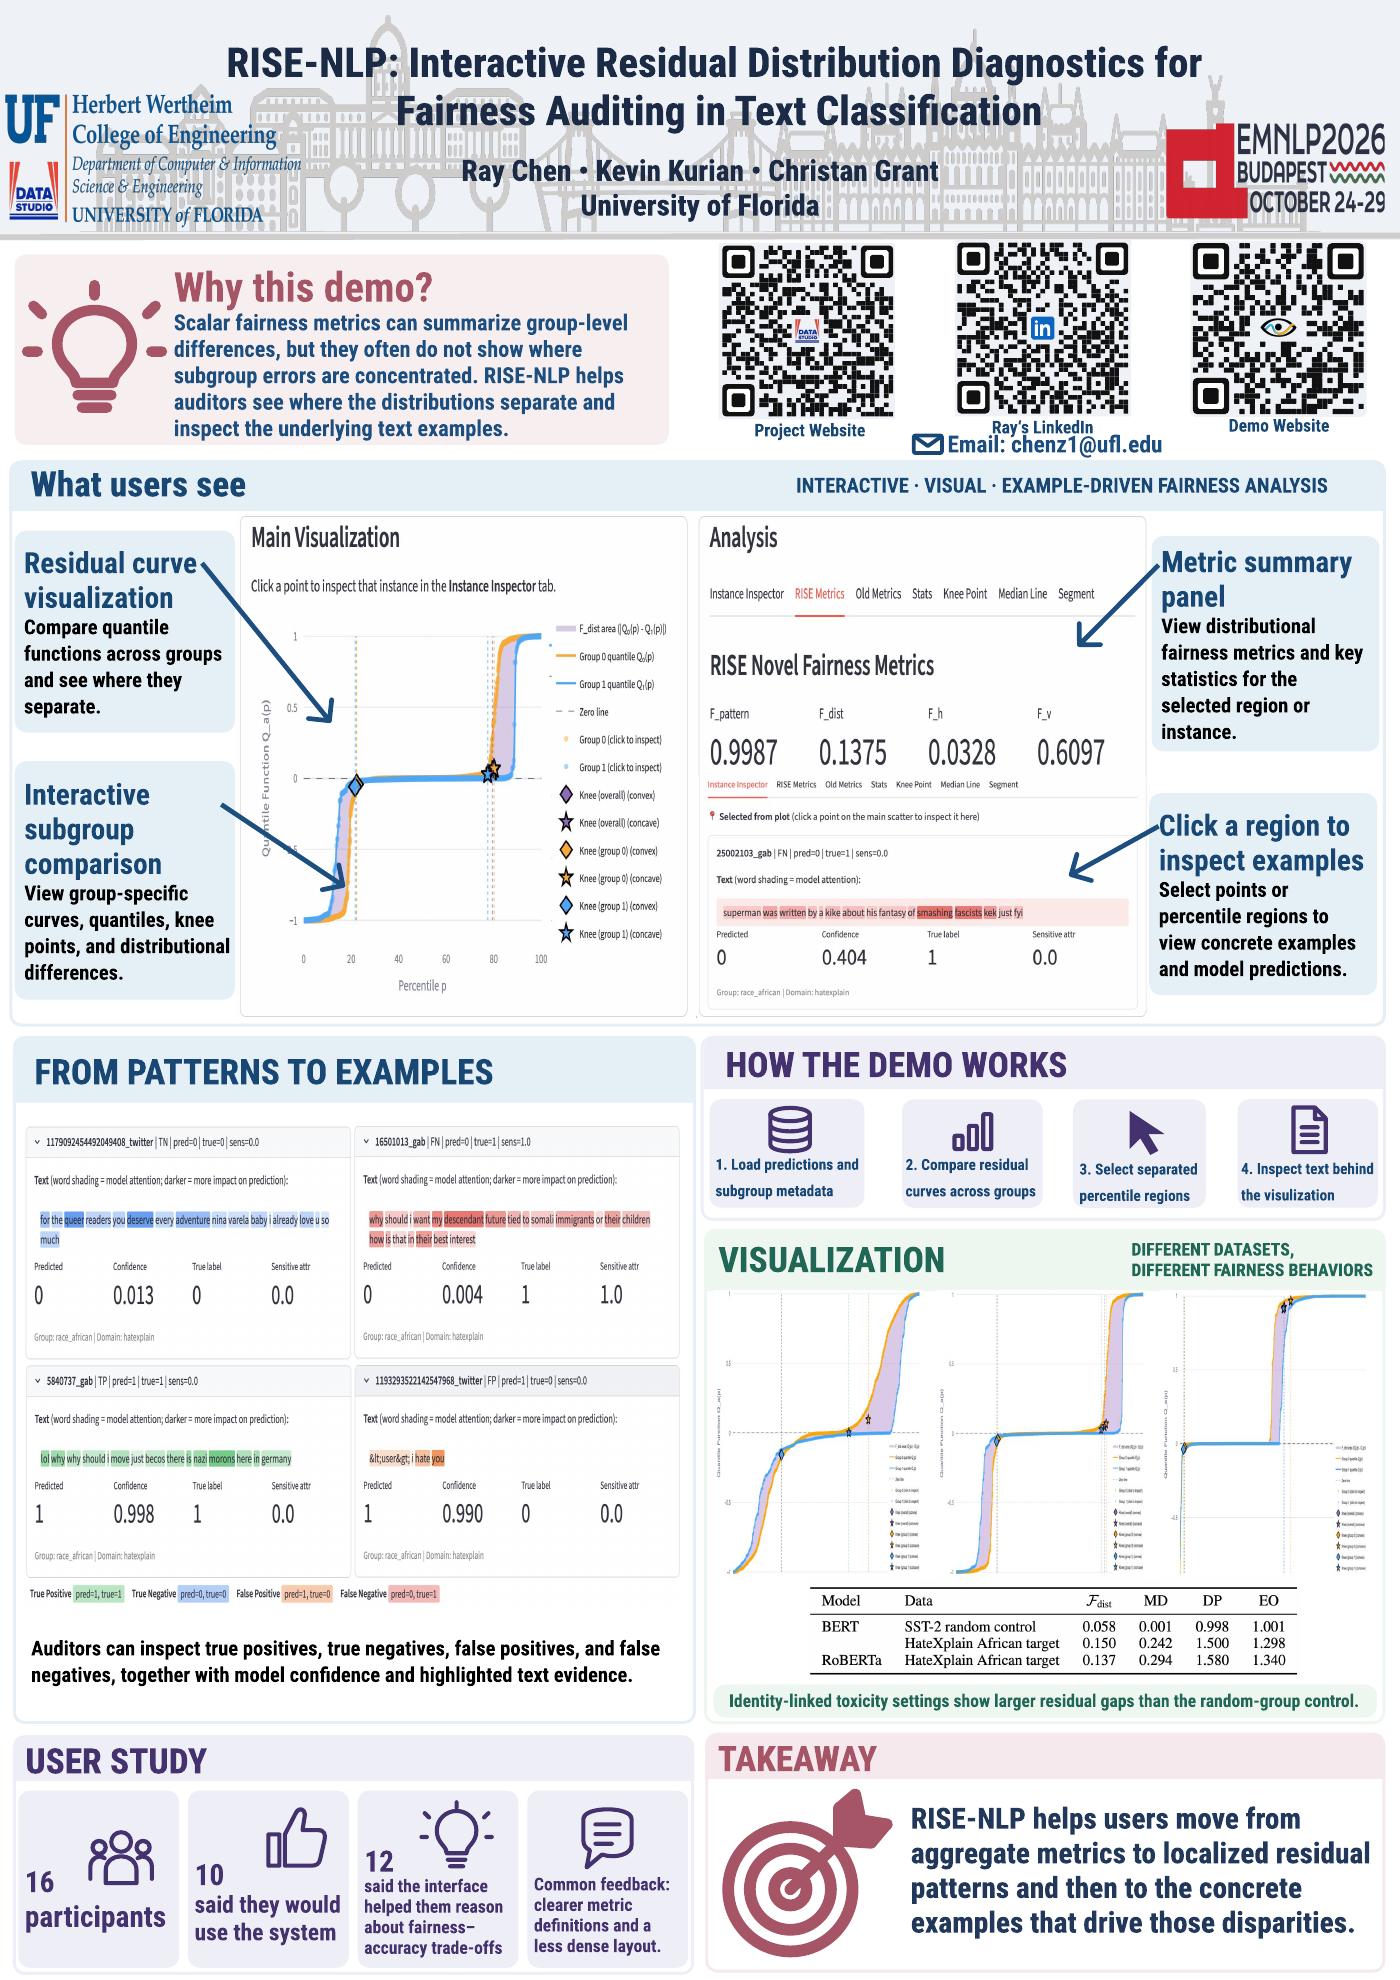
Download the poster (PDF). The poster includes screenshots from hate-speech datasets, and some example sentences contain offensive language.
Demonstration Video
If the video does not play in your browser, watch or download it on Dropbox.
The interface links three layers of analysis in one workflow:
- Distribution-level view: subgroup residual quantile curves and shaded separation area.
- Plot-aligned metrics: Fdist (Wasserstein-1 distance; area between curves) and Fpattern (median residual alignment).
- Instance-level inspection: select percentile regions on the plot and inspect representative text examples, model confidence, labels, and subgroup metadata.
Pipeline
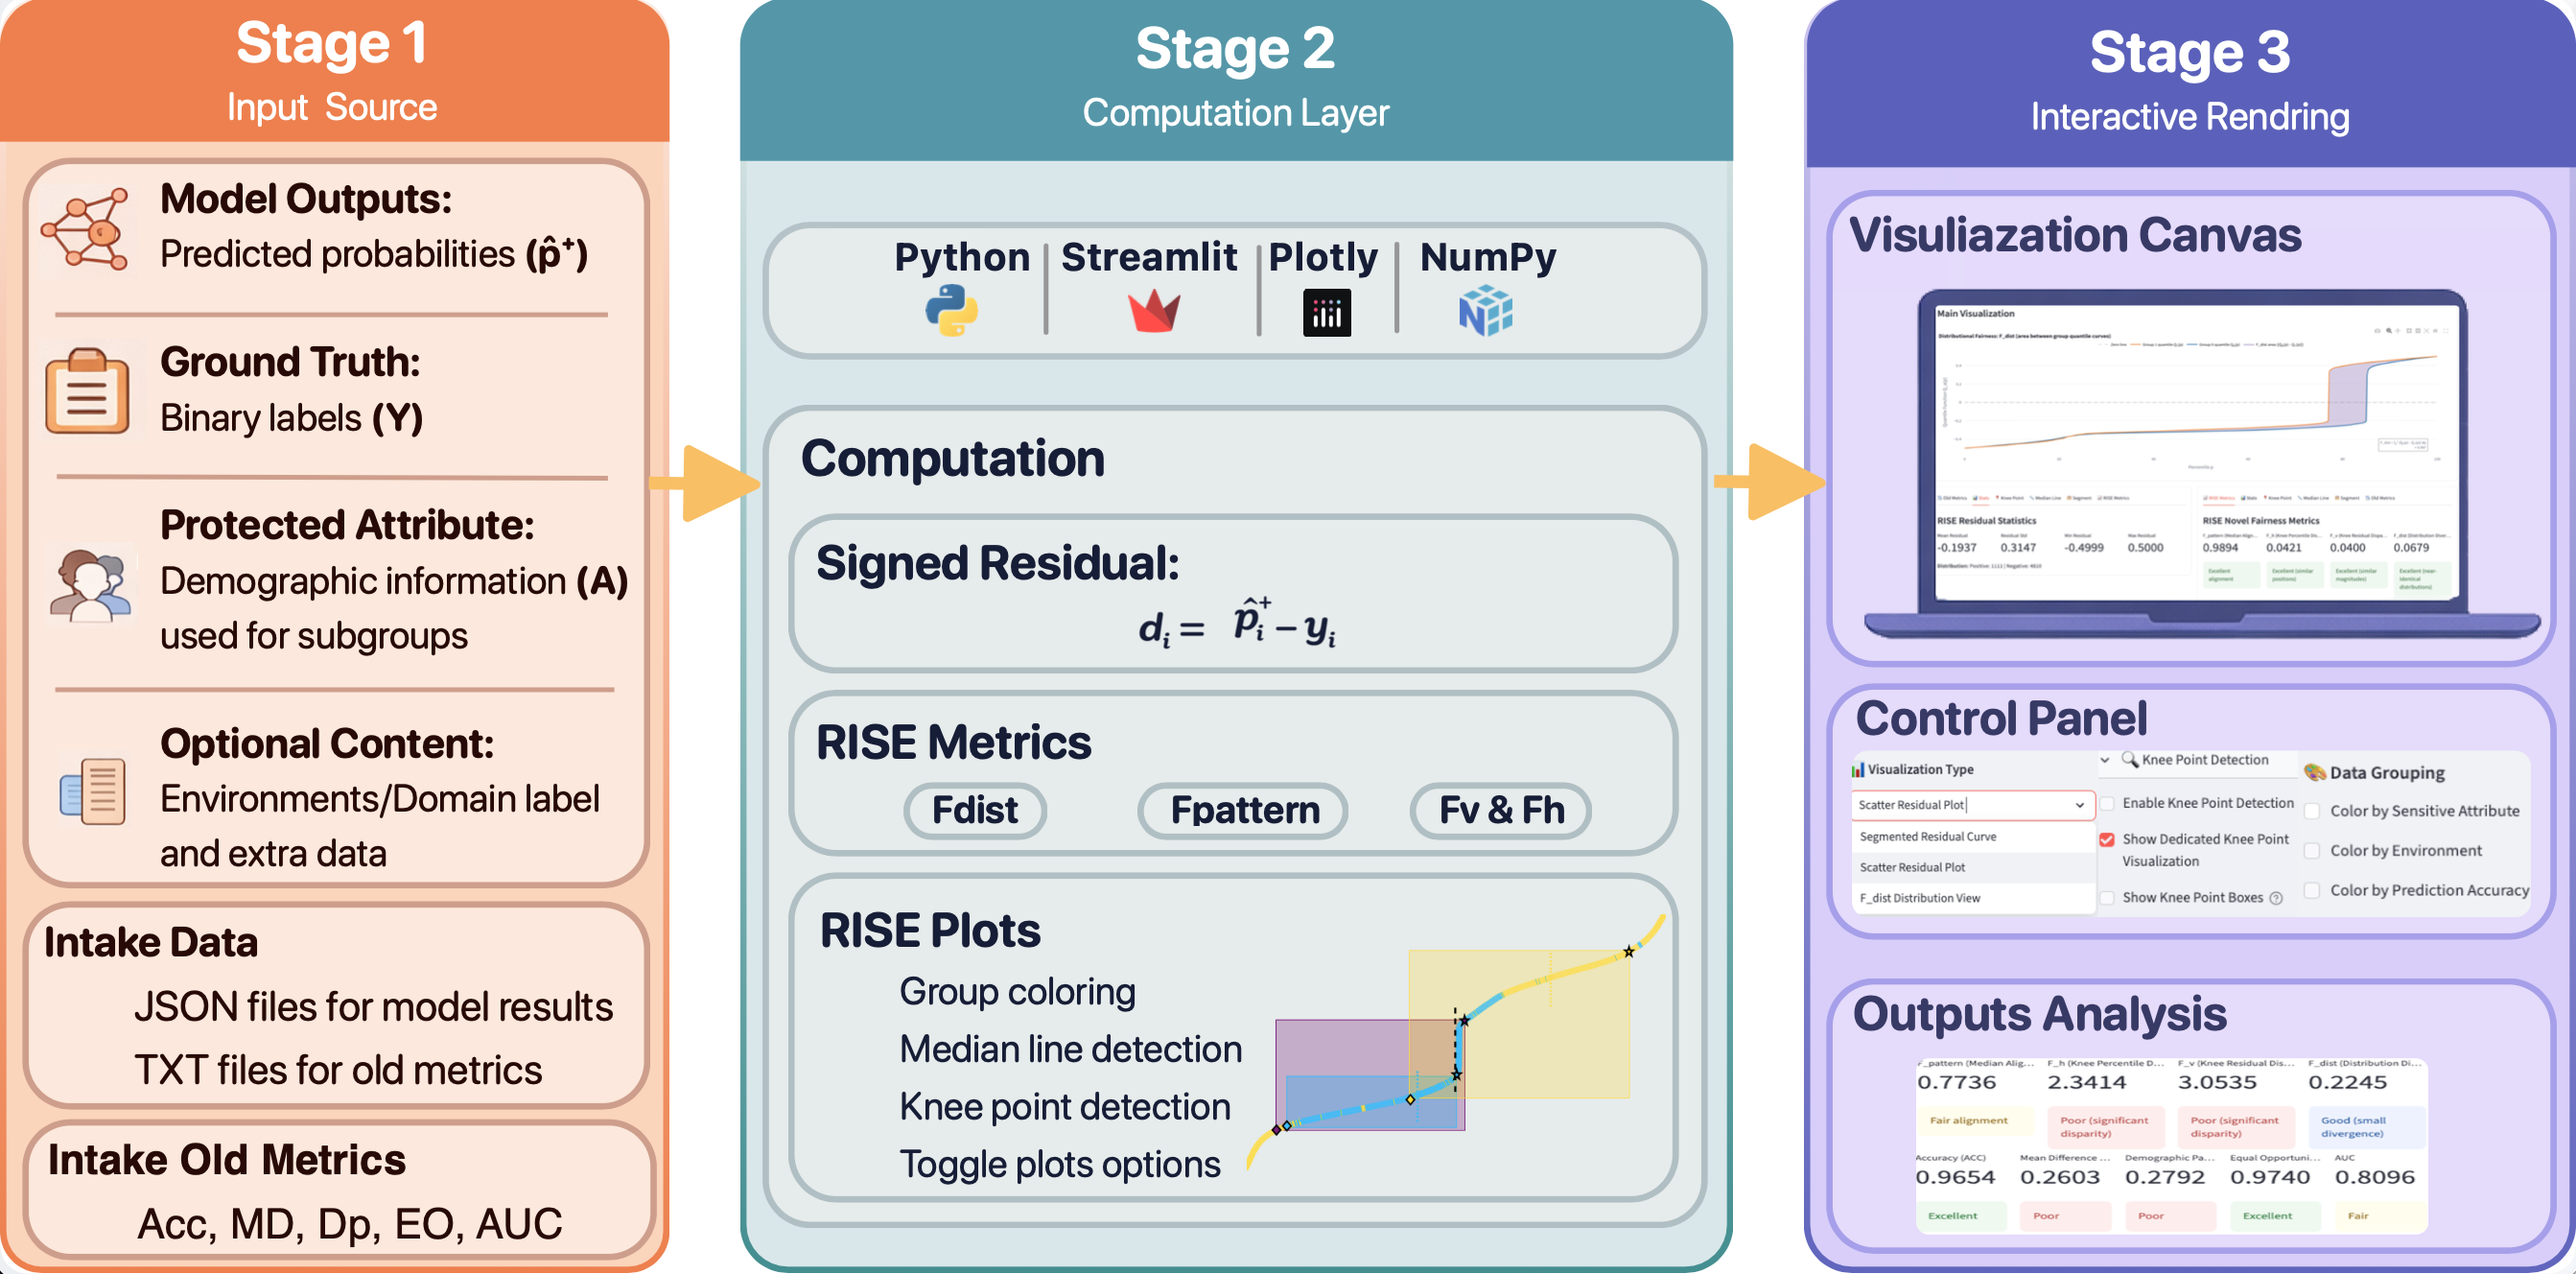
Three-stage RISE-NLP architecture: input source, residual computation and metrics, and interactive rendering for auditing.
Instance Inspector
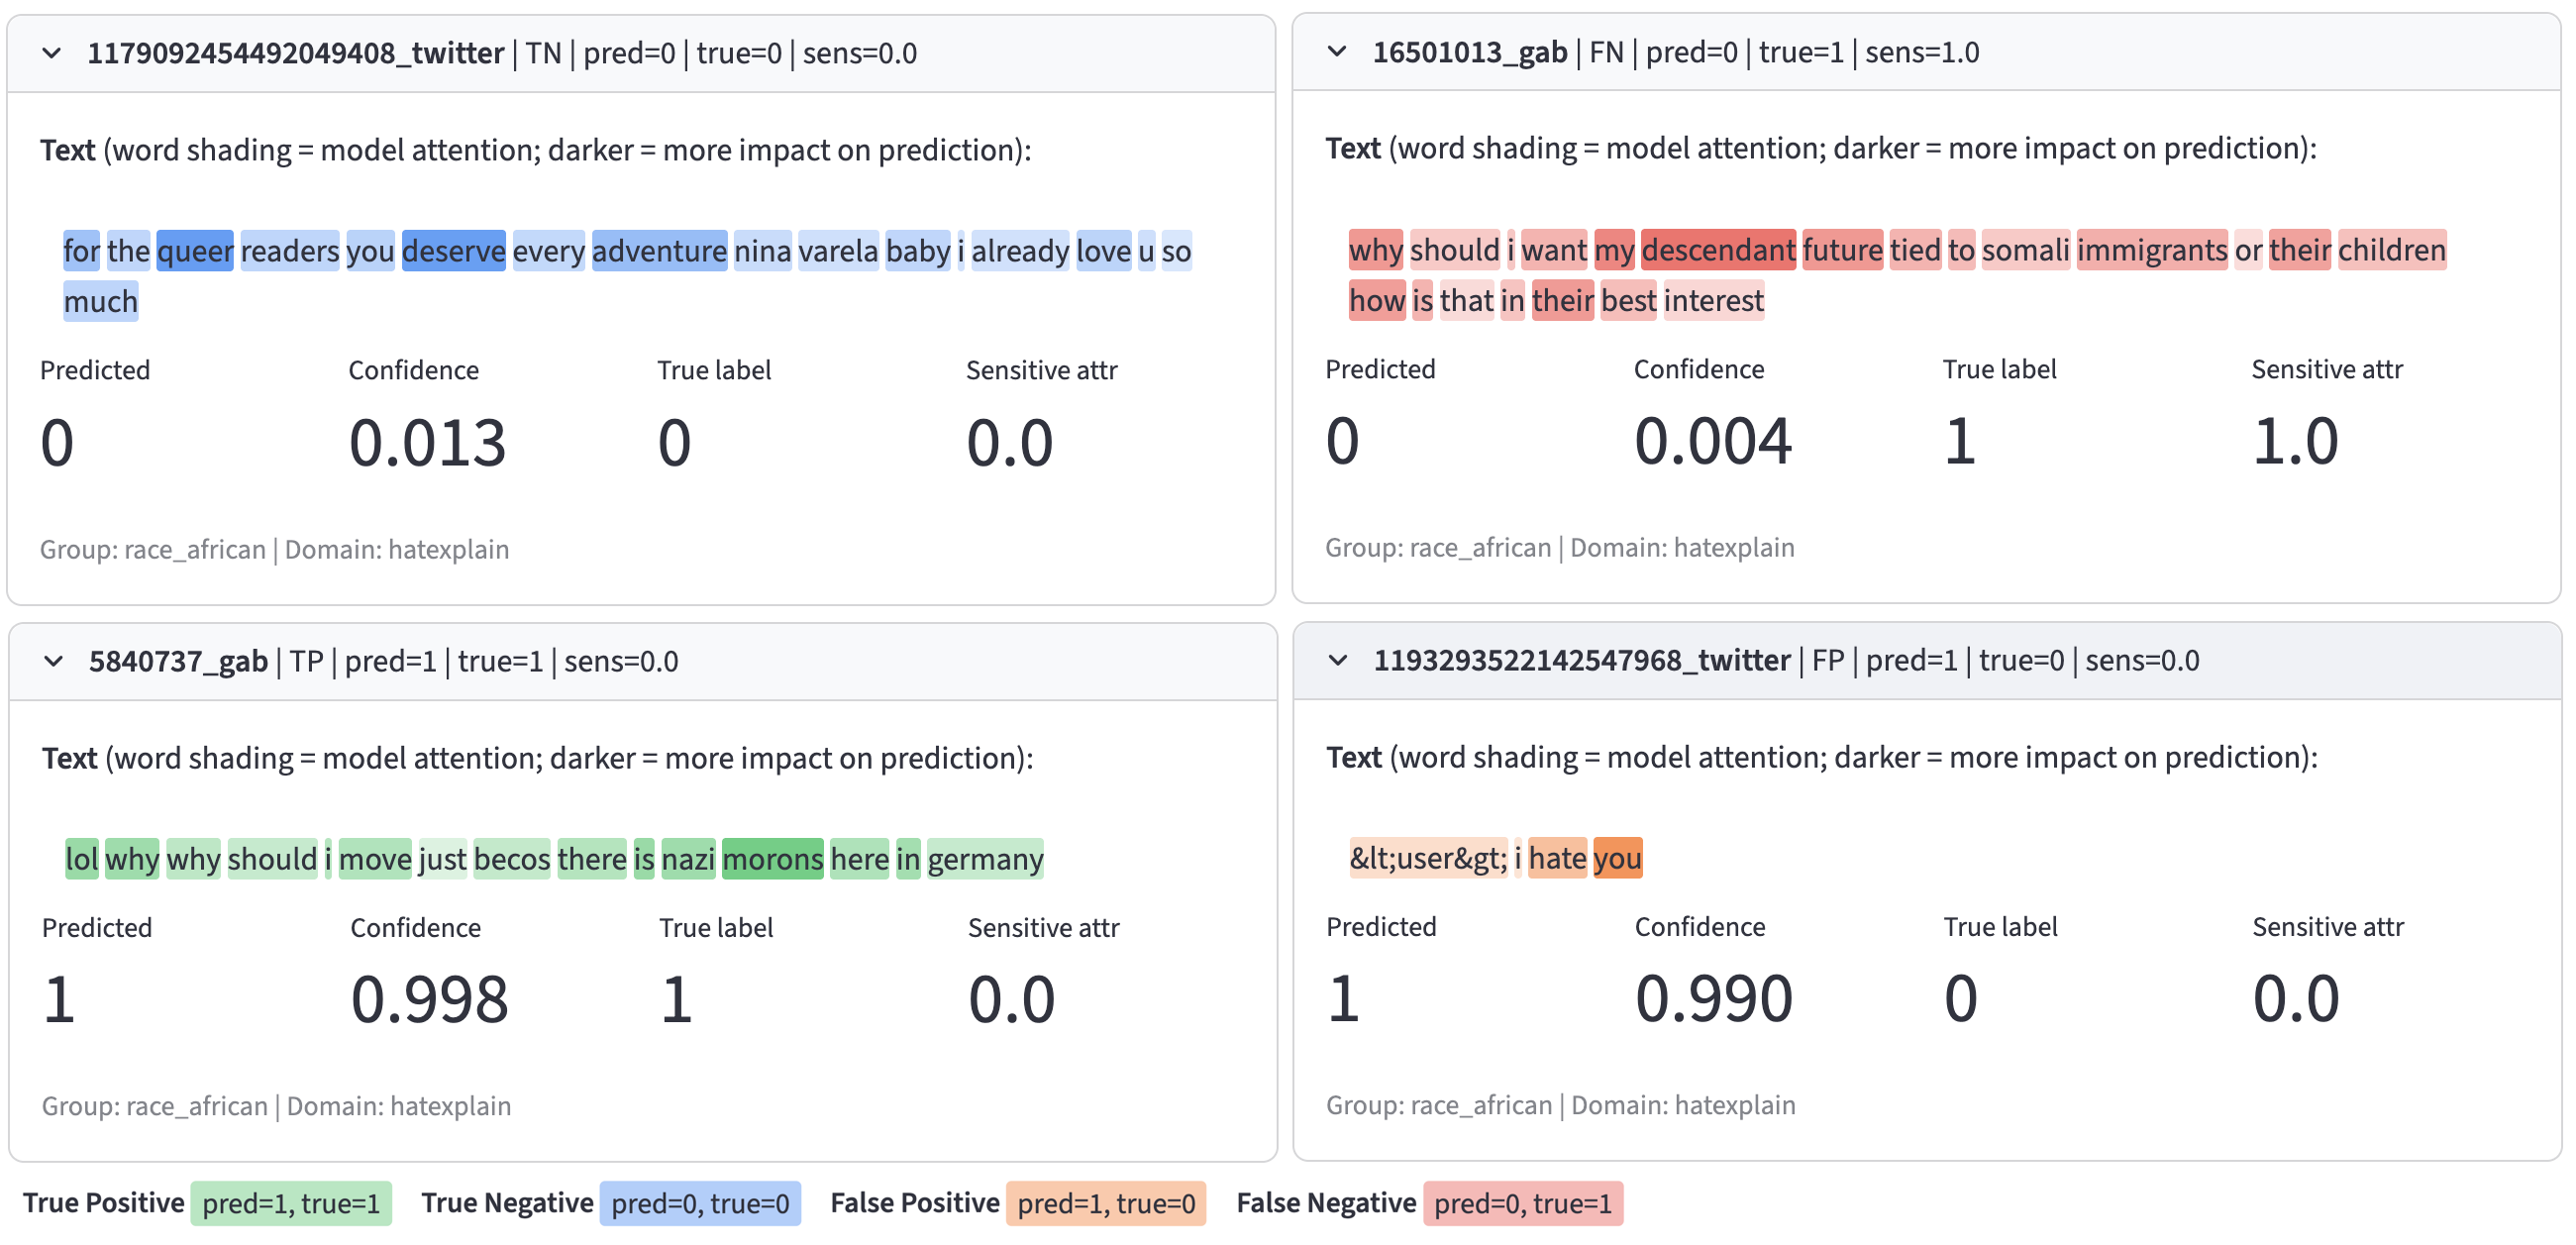
Instance-level inspection view linked to selected residual-percentile regions. Examples may contain offensive language from hate-speech datasets.
Key Results
- Threshold-free subgroup disparity metric:
Fdistdirectly summarizes distributional separation between subgroup residuals and is visually grounded as the shaded area between curves. - Localized diagnostic power: RISE curves show where disparities occur across percentiles, even when scalar metrics appear similar.
- Placebo/control validation: on SST-2 with a random binary attribute, subgroup curves largely overlap and
Fdistremains small (~0.055-0.058), supporting diagnostic specificity. - Identity-linked datasets show larger gaps: for HateXplain and UC Berkeley hate speech data,
Fdistincreases substantially (for example, ~0.137-0.150 on HateXplain), with visible subgroup separation. - Model comparison support: side-by-side analysis of toxicity classifiers (BERT and RoBERTa) helps auditors distinguish similar aggregate scores but different error-distribution behavior.
Team
Code and Data
Publication
- Chen, R., Kurian, K., and Grant, C. RISE-NLP: Interactive Residual Distribution Diagnostics for Fairness Auditing in Text Classification. EMNLP 2026 System Demonstrations, Budapest. BibTeX