RISE-NLP: Interactive Residual Distribution Diagnostics for Fairness Auditing in Text Classification
RISE-NLP is an interactive auditing system for fairness diagnostics in probabilistic text classification. Instead of relying only on threshold-based scalar metrics (for example, Demographic Parity and Equalized Odds), RISE-NLP analyzes signed probability residuals (d = p_hat_plus - y) and compares subgroup residual distributions through quantile curves. This reveals where across the score range subgroup disparities concentrate, including central regions, transition bands, and high-confidence tails.
Demonstration Video
If the video does not play in your browser, watch or download it on Dropbox.
The interface links three layers of analysis in one workflow:
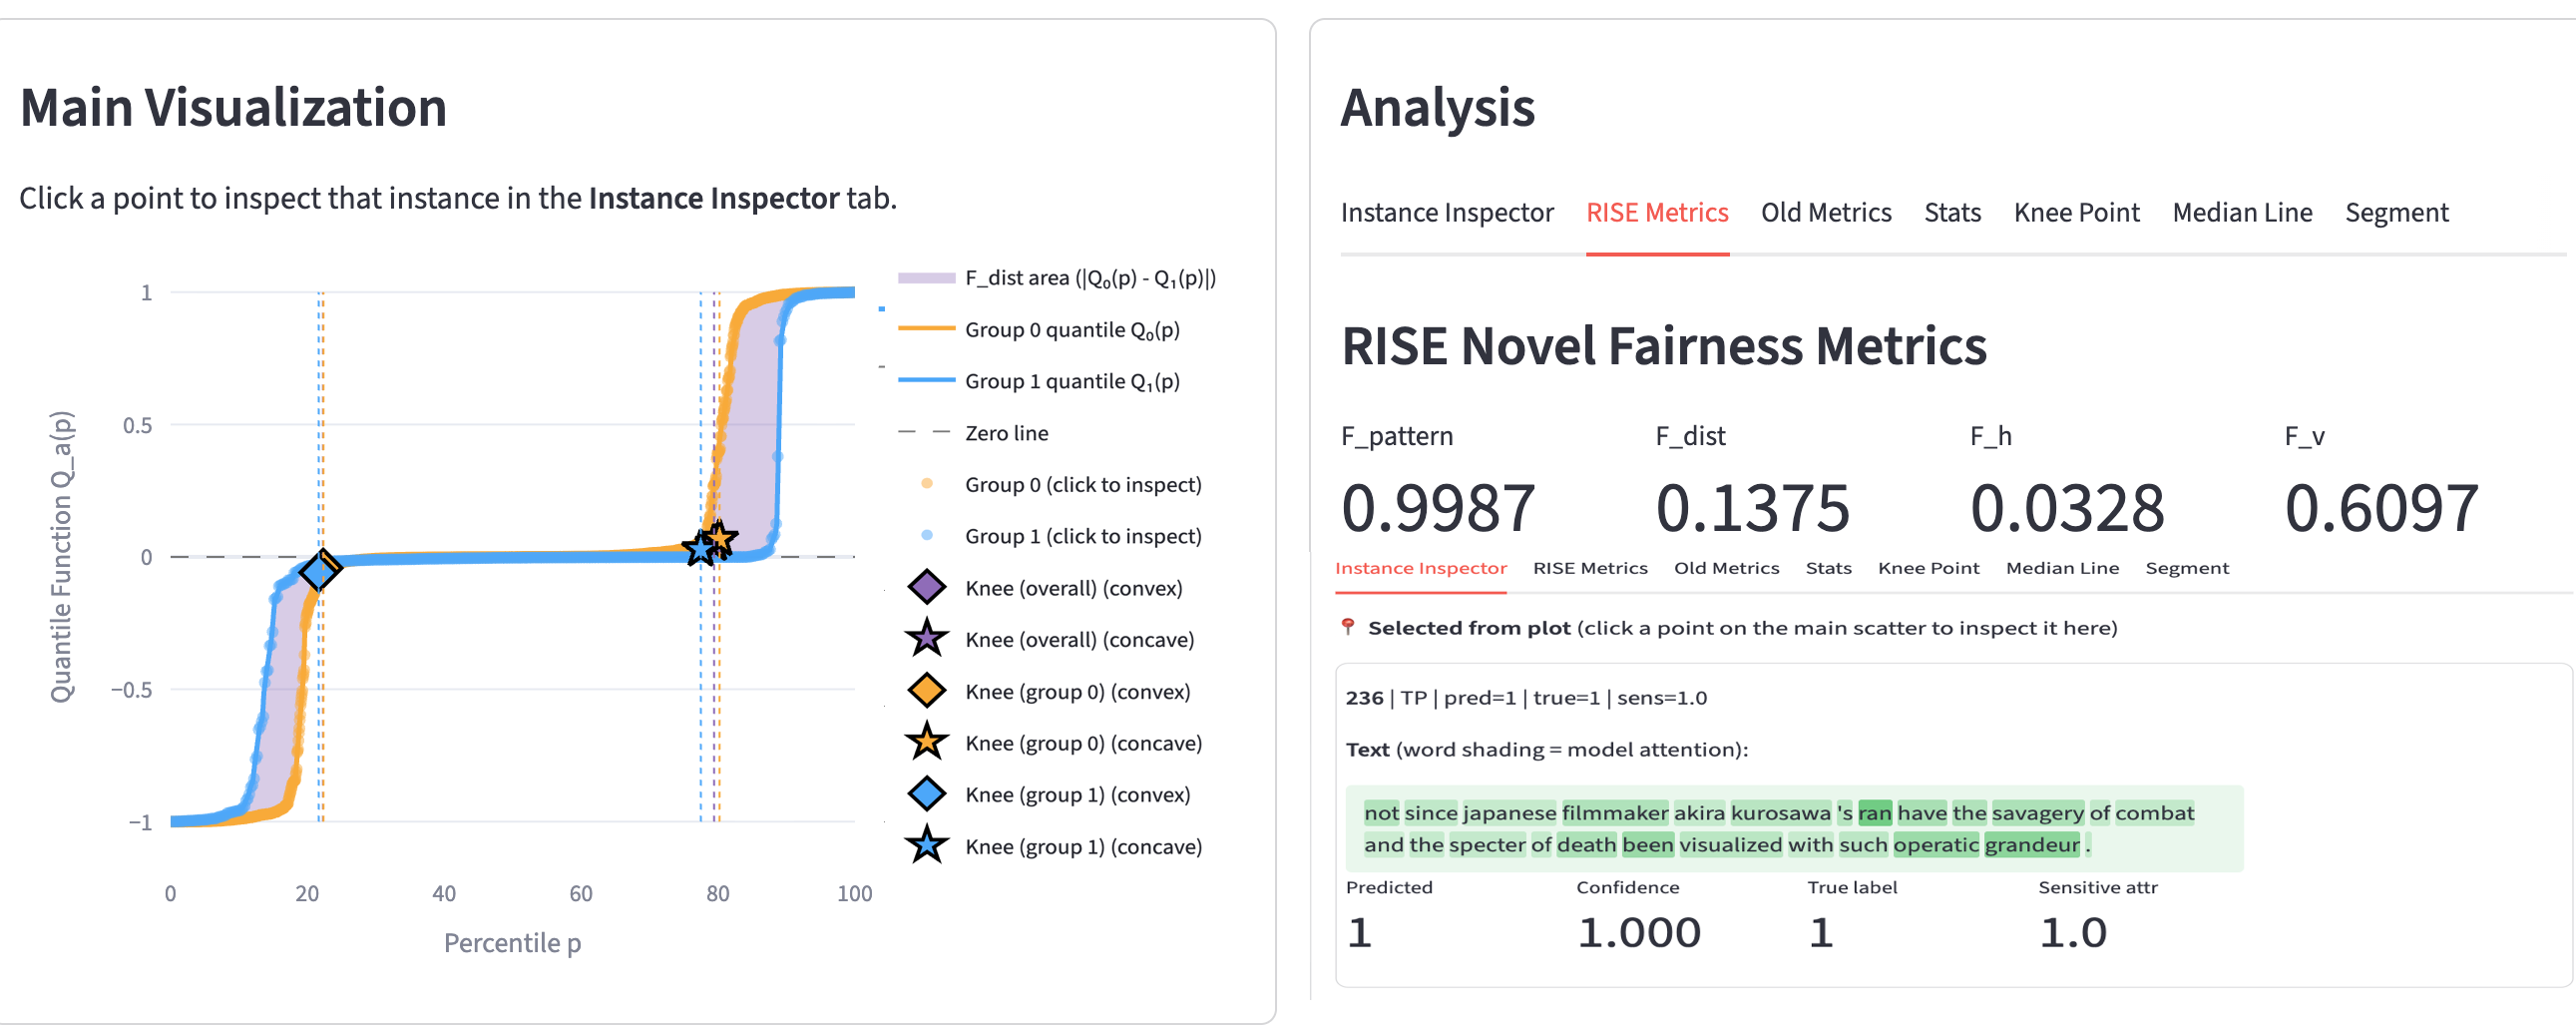
- Distribution-level view: subgroup residual quantile curves and shaded separation area.
- Plot-aligned metrics: Fdist (Wasserstein-1 distance; area between curves) and Fpattern (median residual alignment).
- Instance-level inspection: select percentile regions on the plot and inspect representative text examples, model confidence, labels, and subgroup metadata.
Pipeline
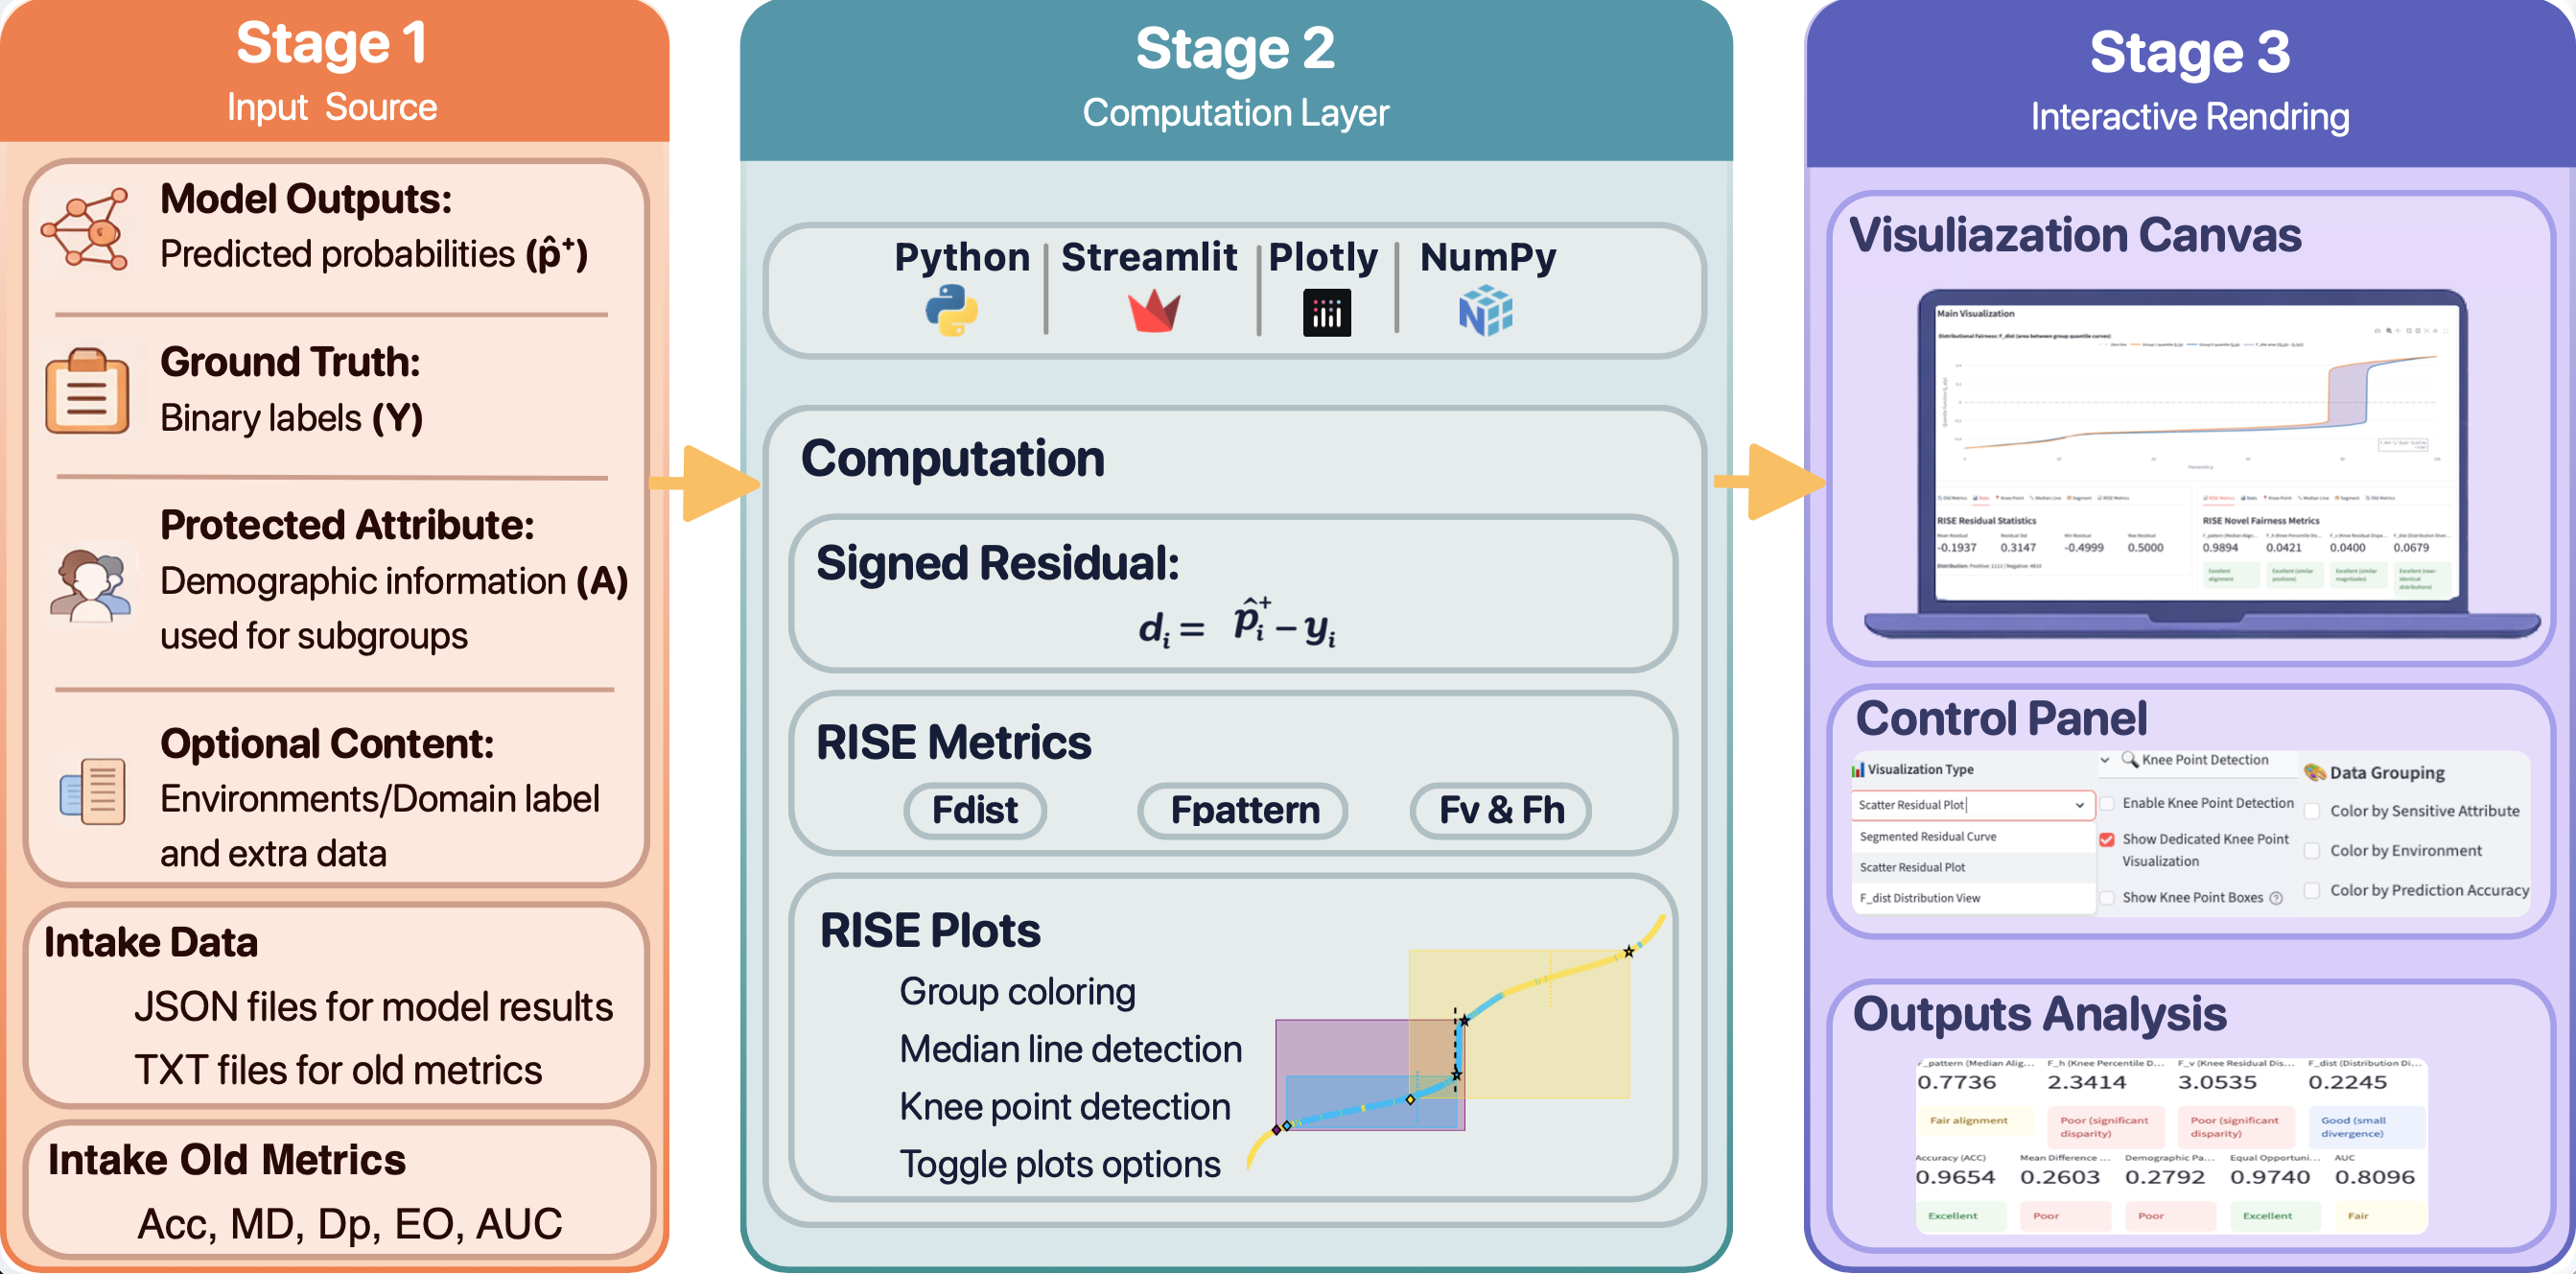
Three-stage RISE-NLP architecture: input source, residual computation and metrics, and interactive rendering for auditing.
Instance Inspector
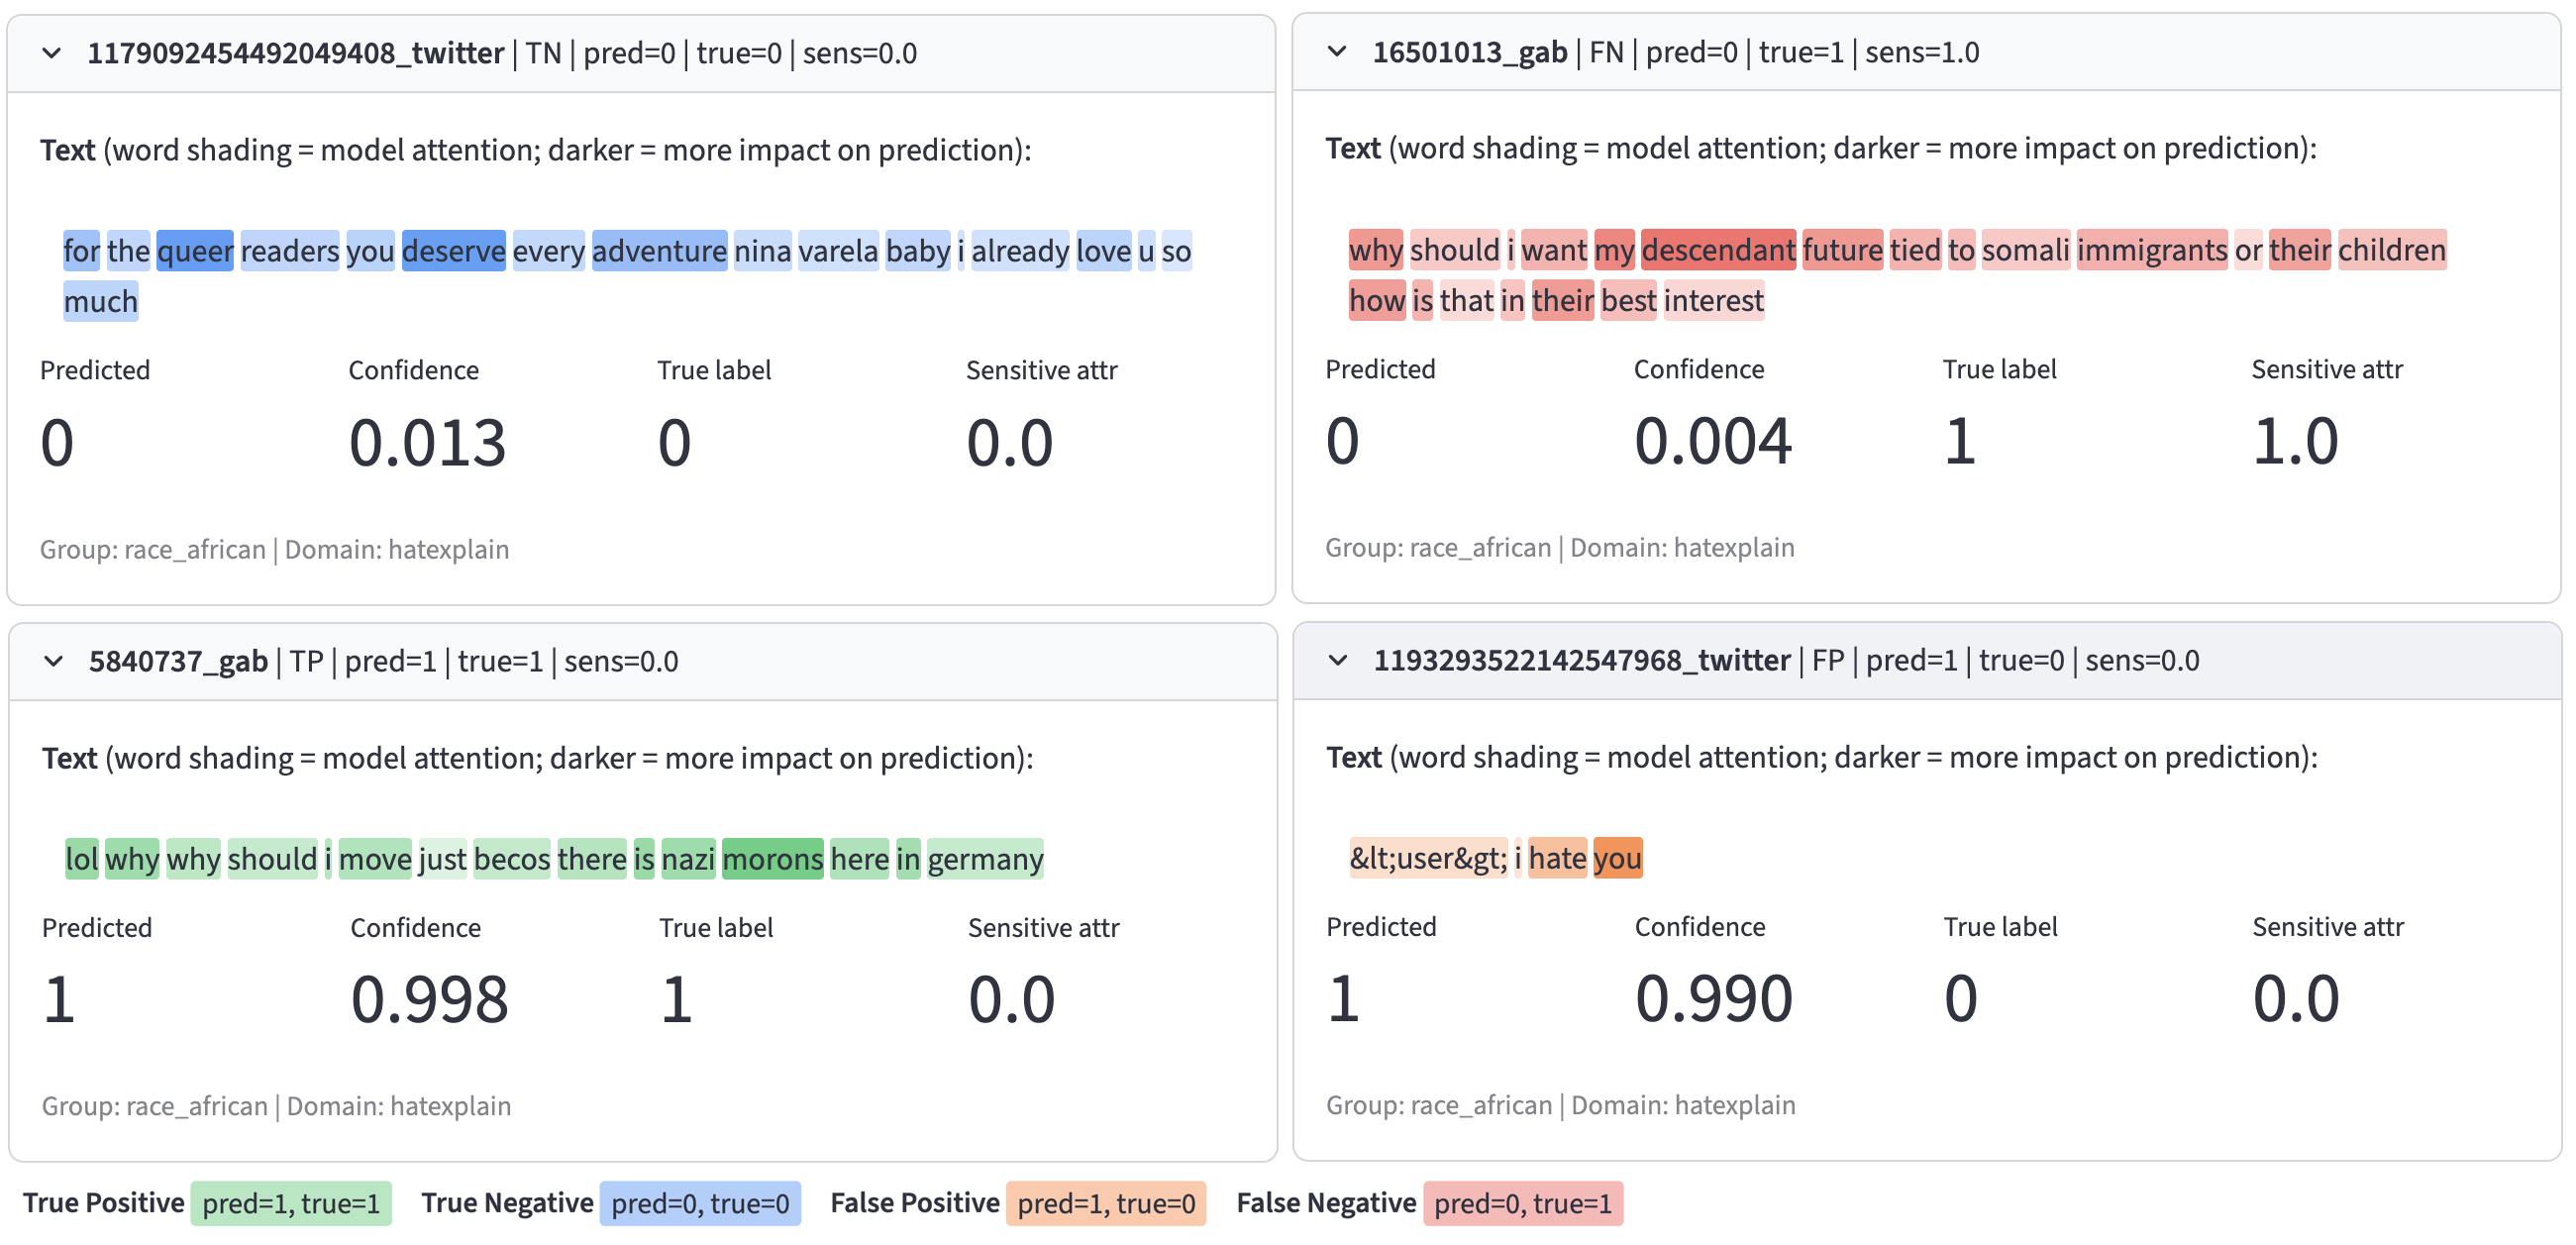
Instance-level inspection view linked to selected residual-percentile regions. Examples may contain offensive language from hate-speech datasets.
Key Results
- Threshold-free subgroup disparity metric:
Fdistdirectly summarizes distributional separation between subgroup residuals and is visually grounded as the shaded area between curves. - Localized diagnostic power: RISE curves show where disparities occur across percentiles, even when scalar metrics appear similar.
- Placebo/control validation: on SST-2 with a random binary attribute, subgroup curves largely overlap and
Fdistremains small (~0.055-0.058), supporting diagnostic specificity. - Identity-linked datasets show larger gaps: for HateXplain and UC Berkeley hate speech data,
Fdistincreases substantially (for example, ~0.137-0.150 on HateXplain), with visible subgroup separation. - Model comparison support: side-by-side analysis of toxicity classifiers (BERT and RoBERTa) helps auditors distinguish similar aggregate scores but different error-distribution behavior.
Team
Code and Data
Related Projects
- Algorithmic Fairness Generalization under Covariate and Dependence Shifts Simultaneously
- [RISE-NLP] (https://ufdatastudio.com/projects/rise/)